• Skip to primary navigation
  • Skip to main content
  • Skip to footer

Teaching in Higher Ed

  • Podcast
  • Blog
  • SPEAKING
  • Media
  • Recommendations
  • About
  • Contact
BLOG POST

Two Basic Excel 2007 Tips for Grading Efficiency

By Bonni Stachowiak | July 21, 2008 | | XFacebookLinkedInEmail

The upgrade to Excel 2007 brought with it some great new features to make managing data easier. When creating Excel-based gradebooks in the past, we would have had to do a lot of manual set up to create design features that are now just a few clicks of the mouse away.

I highlight two such features here, but encourage you to share other tips for grade tracking in Excel 2007 in the comments section.

AUTO TABLE FORMAT

Excel1

Excel has 44 built in auto-formats for tables. To use one of these great-looking formats:

  1. Sort your data (under the data tab)
  2. Highlight your data
  3. Choose format-as-table from the home tab and select your desired format

I find this makes the data more easy to read on screen, since each row is kept more visually separate. It also makes printouts much more appealing and professional.

CONDITIONAL FORMATTING

Excel2

Another great feature is the ability to see visually how each person did in comparison to the others. You used to be able to do this in Excel 2003, but you had to program in the conditional formatting (for example, you might have indicated that if someone scored below 70% that you wanted the font to be displayed in a red color).

Excel 2007 makes this much easier, plus you have far more options available in terms of your formatting.

Excel3

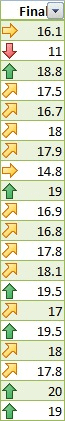
In my example, I selected the red/yellow/green arrow formatting, to quickly see which students scored the best and worst on the final exam. To create custom formatting:

  1. Select the collumn you want to format
  2. Choose conditional formatting from the home tab
  3. Indicate which custom formatting you wish to use

This only scratches the surface of what you can to in Excel to track data, but I know it is better to give information in bite-sized pieces. Give it a try as you set up this next semester's gradebook and feel free to share other tips in the comments section.

Filed Under: Teaching Tagged With: excel, grading, productivity

Bonni Stachowiak

Bonni Stachowiak is the producer and host of the Teaching in Higher Ed podcast, which has been airing weekly since June of 2014. Bonni is the Dean of Teaching and Learning at Vanguard University of Southern California. She’s also a full Professor of Business and Management. She’s been teaching in-person, blended, and online courses throughout her entire career in higher education. Bonni and her husband, Dave, are parents to two curious kids, who regularly shape their perspectives on teaching and learning.

Woman sits at a desk, holding a sign that reads: "Show up for the work."

GET CONNECTED

JOIN OVER 4,000 EDUCATORS

Subscribe to the weekly email update and receive the most recent episode's show notes, as well as some other bonus resources.

Please enter your name.
Please enter a valid email address.
JOIN
Something went wrong. Please check your entries and try again.

Related Blog Posts

  • Efficiency and effectiveness with rubrics
  • More on blind grading
  • Checklist for class planning efficiency

TOOLS

  • Blog
  • Podcast
  • Community
  • Weekly Update

RESOURCES

  • Recommendations
  • EdTech Essentials Guide
  • The Productive Online Professor
  • How to Listen to Podcasts

Subscribe to Podcast

Apple PodcastsSpotifyAndroidby EmailRSSMore Subscribe Options

ABOUT

  • Bonni Stachowiak
  • Speaking + Workshops
  • Podcast FAQs
  • Media Kit
  • Lilly Conferences Partnership

CONTACT

  • Get in Touch
  • Support the Podcast
  • Sponsorship
  • Privacy Policy

CONNECT

  • LinkedIn
  • Instagram
  • RSS

CC BY-NC-SA 4.0 Teaching in Higher Ed | Designed by Anchored Design